D. E. SMITH*†, S. J. TANS*†, S. B. SMITH‡, S. GRIMES§, D. L. ANDERSON§
& C. BUSTAMANTE†
 .
.
Smith DE, Tans SJ, Smith SB, Grimes S, Anderson DL, Bustamante
C.
The bacteriophage straight phi29 portal motor can package DNA against a large
internal force.
Nature. 2001 Oct 18;413(6857):748-52. 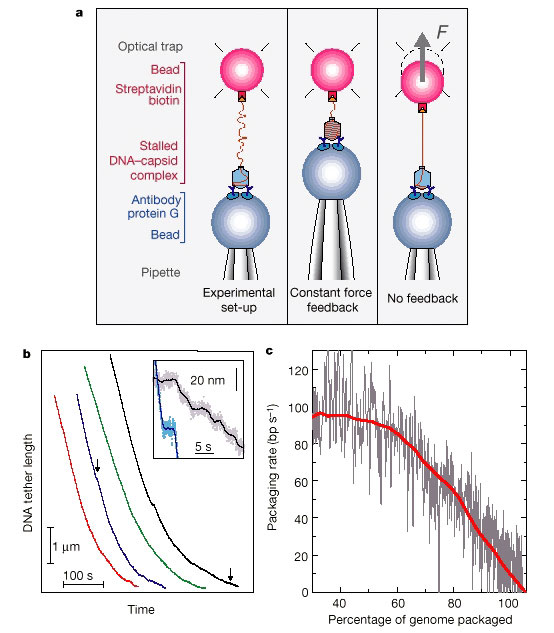
Figure 1 Set-up and initial
results. a, Diagrams showing the experimental set-up at the start of a
measurement (left), constant force feedback mode (middle) and no feedback
mode (right) measurements.
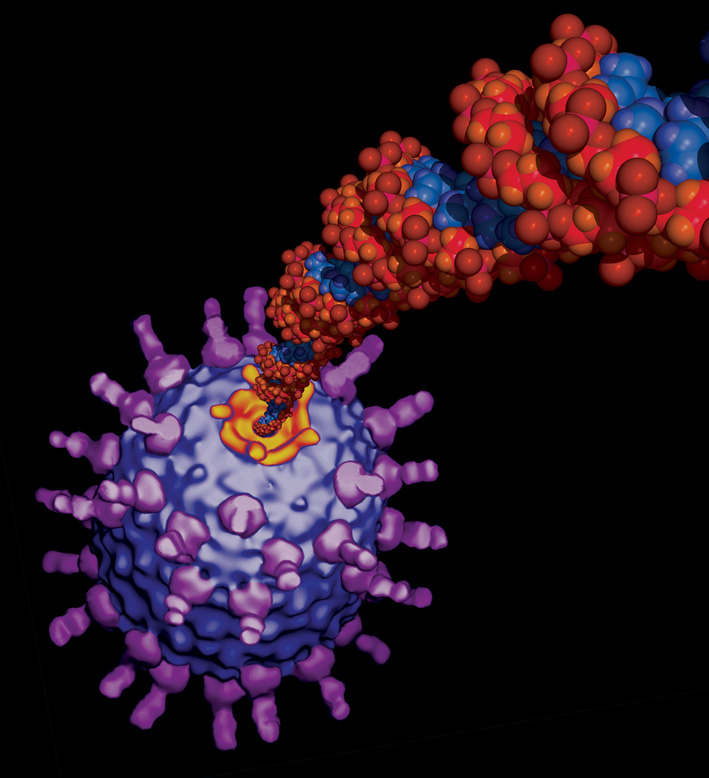
A single 29 packaging complex is tethered between
two microspheres. Optical tweezers are used to trap
one microsphere and
measure the forces acting on it, while the other microsphere is held by a
micropipette. To insure measurement on only one complex, the density of
complexes on the microsphere is
adjusted so that only about one out of
five–ten microspheres yielded hook-ups. Such attachments break in
one
discrete step as the force is increased, indicating that only one DNA molecule
carries the load. b,
DNA tether length against time for four different
complexes with a constant force of 5 pN using a
34.4-kb 29- DNA construct.
Inset, increased detail of regions, indicated by arrows,
showing pauses
(curves have been shifted). The solid lines are a 100-point average of the raw
data. c,
Packaging rate against the amount of DNA packaged, relative to the
original 19.3-kb 29 genome. Grey
line, trace for a single complex (derived
from black trace in b). Rates were obtained by linear fitting in a
1.5-s
sliding window. The red line is an average of eight such measurements. Large
pauses (velocity drops
>30 bp s-1 below local average) were removed, and
the curves were horizontally shifted to account for
differences in
microsphere attachment points. The red line was smoothed using a 200-nm sliding
window.
The standard deviation for the ensemble of measurements varies from
20 bp s-1 at the beginning,
down to 10 bp s-1 at the end. 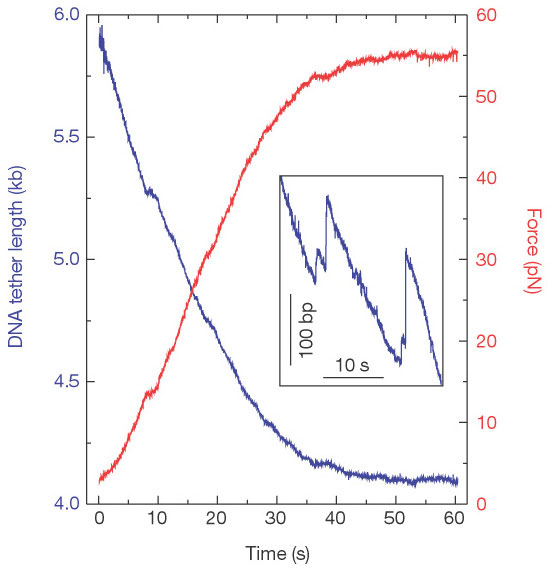
Figure 2
Measurements of packaging in no feedback mode. The tether shortens (blue line)
and the force
increases (red line) as the portal motor pulls in the DNA. In
this example, the motor stalled at a force of
55 pN. Although in many
measurements the linkage broke before stalling was observed, similar
maximum
forces could be projected from these curves. We suspect that such breakage
events occur at the
antibody–prohead connection. Inset, spontaneous slipping
events, where the DNA comes out of the
capsid, were accompanied with abrupt
decreases in force. 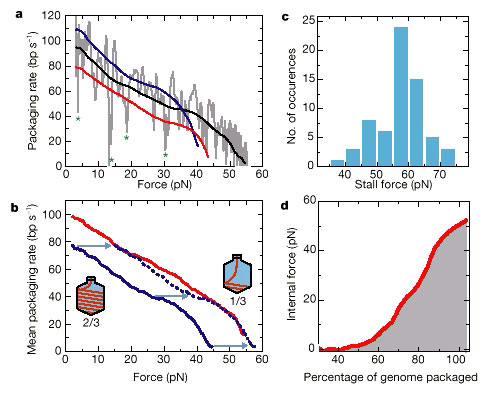
Figure 3 Force–velocity (F-v) analysis. a, The packaging rate for
a single complex (grey line) was
determined by linear fitting of the data in
Fig. 2 in a 0.7-s sliding window. The black line is obtained by
editing out
large pauses (asterisks indicate where velocity drops >30 bp s-1 below local
average) and
smoothing (50-point sliding window). These long pauses were
removed so as not to perturb the general
trend of the F–v behaviour. The red
and blue lines are data from two other complexes. b, External force
against
velocity curves when about one-third (red line) and about two-thirds (blue line)
of the genome is
packaged. Curves were obtained from averaging 14 and 8
individual traces, respectively. If, in the case of
two-thirds of the genome
being packaged, an additional 14 pN of internal force were acting on the motor
(see text), the dashed blue line would show the expected behaviour. The red
line and the dashed blue lines
would then represent the inherent (total) F–v
curve for the motor. c, Stall force measured for 65 individual
complexes
indicates an average stall force of 57 pN. Stall force refers to the total force
(external force
plus, in the case of two-thirds of the genome being
packaged, the inferred internal force of 14 pN), which
is needed to stop
further packaging. Clear plateaux (slope <5 bp s-1 for >5 s) in the force
against time
plots were sometimes observed (for example, in Fig. 2). The
average force over this plateau is taken as the
stall force. In some cases
the packaging rate dropped by more than 80% (to below <20 bp s-1), but the
tether broke before a full plateau was reached. In these cases we
extrapolated to obtain an estimate of the
stall force, as the shapes of
truncated curves were similar to those that fully stalled. DNA over-stretching
was not observed because linkages always broke at external forces lower than
65 pN. However, stall
forces above 65 pN could be determined in cases where
internal force added to the total force. d, Internal
force against
percentage genome packaged. This plot is obtained by relating the packaging
rate, as
obtained from the rate against percentage of genome packaged curve
(Fig. 1c), to the total force required
to produce the same packaging rate,
as given by the rate against force curve (b, average of red and
dashed blue
lines). To obtain the internal force, we subtracted the 5 pN of external force
that is present in
the experiment of Fig. 1c.