Unless otherwise stated, in the following sections
all changes of variables are done with respect
to  and
and  defined by eq. 5 of section 2,
even though those quantities might not be the equilibrium values
of the modified model used in that section.
defined by eq. 5 of section 2,
even though those quantities might not be the equilibrium values
of the modified model used in that section.
 and
and  will be further referred to as the
harvesting equilibrium in the sense that
they are the equilibrium values for a model with only one negative term
in the resource equation, namely the harvest term.
will be further referred to as the
harvesting equilibrium in the sense that
they are the equilibrium values for a model with only one negative term
in the resource equation, namely the harvest term.
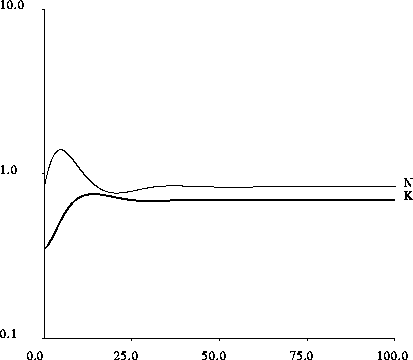
Figure 5: Time plot of the resource level and capital for the model of section 3, which
accounts for situations where the resource is of the same order as the
carrying capacity. N and K are normalized by  and
and  of section 2, respectively. The first upward oscillation of the resource
is damped by the presence of the carrying capacity, resulting in a
smaller amount of resource depletion. In this figure
of section 2, respectively. The first upward oscillation of the resource
is damped by the presence of the carrying capacity, resulting in a
smaller amount of resource depletion. In this figure
 ,
,  , the initial resource level
is taken to be at the equilibrium of
, the initial resource level
is taken to be at the equilibrium of  ,
and the initial capital at half of its equilibrium value,
so that
,
and the initial capital at half of its equilibrium value,
so that  .
.
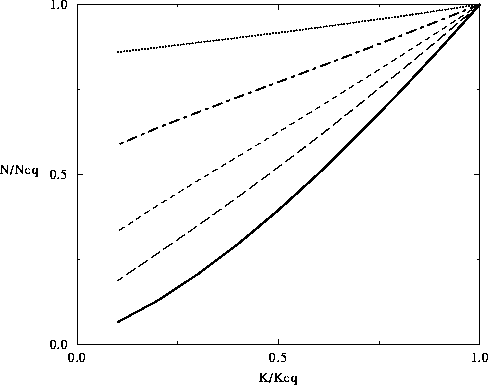
Figure 6: Influence of the carrying capacity on resource
depletion. The magnitude of the resource depletion is plotted on the vertical axis
as a function of the distance from equilibrium for each of the four
values of the ratio between carrying capacity
and harvesting equilibrium (40, long dashes;
20, short dashes; 10, dot dash and 5 dotted line)
and for the model of section 2, solid line, which would correspond to an infinite
carrying capacity. The existence of a carrying capacity reduces
resource depletion, even when the carrying capacity is rather
high with respect to the harvest equilibrium.
The carrying capacity can be normalized the same way as N,
 with respect to
  given by eq. 5,
giving
given by eq. 5,
giving  ,
and the new nondimensionalized model is:
,
and the new nondimensionalized model is:
This model has three equilibria at  ,
,  and
and
 ).
).
These first two equilibria are unstable.
Near the usual attractor, set  ,
,
 and linearize to get:
The eigenvalues are
where  .
.


