 relative to the harvesting equilibrium,
  , of section 2.
Alternatively, harvesting reduces the level of the natural resource
by a factor of
  relative to the carrying capacity.
The existence of a carrying capacity reduces the
equilibrium value for the resource by a factor of  relative to the harvesting equilibrium,
  , of section 2.
Alternatively, harvesting reduces the level of the natural resource
by a factor of
  relative to the carrying capacity.
The absolute value of the real part of  , which determines
the strength of the attraction towards the equilibrium, is strongly increased
when the carrying capacity is of the same order as
the harvesting equilibrium
  . It can be observed on the time
plot of figure 5 that the carrying capacity limits
the upward oscillation of the resource, thus limiting the overshoot
and the subsequent backlash. This corresponds to the
results shown in figure 14: the resource
depletion curve for a carrying capacity
of five times the harvesting equilibrium is well above
the same curve in the absence of a carrying capacity.
In other words, if resources were harvested at a rate
such that the harvesting equilibrium were of the same order
of magnitude as the
carrying capacity then resource depletion would not be a
big issue, even for small values of
  .
.
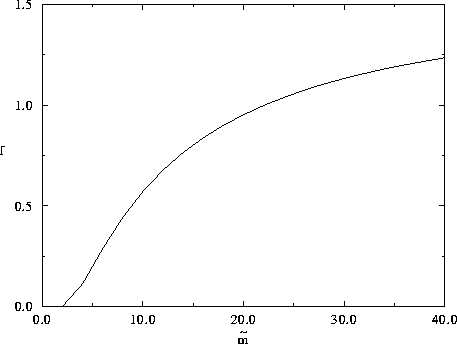
Using equation 26, the linear fragility of the system is now given by
The variations
of f with  are represented on figure 7.

Figure 7: Linear fragility, defined in the text as the ratio
between relative resource depletion to initial relative capital
distance to equilibrium (see figure 3)
is represented as a function of  , the ratio of
the carrying capacity to the harvesting equilibrium
for a
  coefficient of 0.1. Computation is done
according to equation 28. Resource depletion is strongly
attenuated by the existence of a carrying capacity
of the same order as the harvesting equilibrium.
The stronger attenuation of the oscillations
by the carrying capacity
is accompanied by a decrease in the size of the  region
in which oscillations occur. The following values of
 limit the oscillation region:
For instance, when the carrying capacity m is large compared to
the harvesting equilibrium  , the upper range in
  of the oscillatory
region is decreased to
  instead
of the limit of 8 which was found for the system without carrying capacity.