 is greater than 2, the equilibrium becomes unstable.
The analytical global stability analysis has not been done,
but simulation results show that the system
sometimes has a Hopf bifurcation towards a limit cycle, and
sometimes simply diverges.
Once  is greater than 2, the equilibrium becomes unstable.
The analytical global stability analysis has not been done,
but simulation results show that the system
sometimes has a Hopf bifurcation towards a limit cycle, and
sometimes simply diverges.

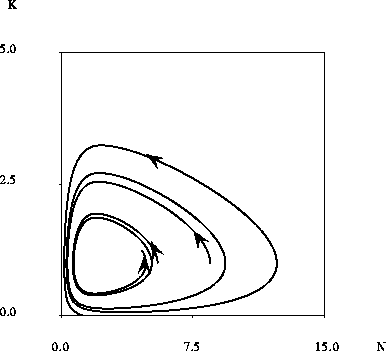
Figure 12: The unstable limit cycle (separatrix)
of the minimum consumption
model of section 5 shown on the phase portrait.
The equilibrium point is surrounded by an unstable limit cycle. Inside the separatrix solutions approach the equilibrium, while outside oscillations increase in amplitude until the
boundary K=0 is reached. This plot shows two trajectories for the case  ,
, 
 =0.8;
=0.8;  .
.
 is plotted against
  . Arrows show the direction of the trajectory as time increases. Initial coordinates are
  = (5.5, 1) and (8.5, 1).
Oscillations occur in the vicinity of this
equilibrium point when  .
If we are in the situation
where the minimum consumption
  and the sharpness
coefficient
  are small then
  is approximately 1 and the condition for oscillations
simplifies (approximately) to
  , or
, or  Thus this condition does not reduce to that of the baseline model
of section 2, and we
should not expect it to since the equations near the equilibrium point are
different.
According to whether the initial conditions are within the basin of attraction of the equilibrium or not, the addition of a minimum consumption has different effects on resource depletion (Figure 11). Inside the basin of attraction it reduces the amount of capital that can be accumulated. The resource cannot be depleted down to the levels reached without the minimum consumption assumption. This decreases the amplitude of the swings, as seen in Figures 11a and 14. But, outside the attraction basin, the lack of capital for re-investment during those hard times when consumption is maintained at its minimum results in a fast capital decrease that eventually finishes with a system crash (see figure 11b). A phase portrait of the dynamics is presented for similar conditions in figure 12.

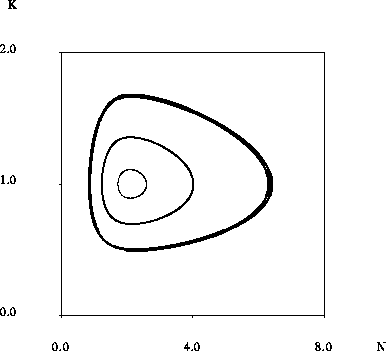
Figure 13: A stable limit cycle of the minimum consumption
model of section 5. A limit cycle is observed above the equilibrium
instability transition obtained at large minimum consumption.
This limit cycle is shown for the case  ,
,  =
=  ,
,  ,
,  , for 3 different sets of initial
conditions.
It is difficult to see, but the inside trajectory (
 )
is gradually
moving outward, the outside trajectory (
 ) moves inward,
and the center trajectory
  , is essentially
periodic. In each case, N starts at the equilibrium value of
  .
The region of attraction of the limit cycle is limited: not shown is an
unstable limit cycle separating the region of attraction of the inner limit
cycle from an unstable region where solutions always reach the K = 0
boundary, just as in the previous figure.
Numerical simulations allow us to investigate the global stability.
At large values of  and
and  , e.g. .8 and .2,
there exists a separatrix which prevents interior trajectories
from going to infinity. When
  approaches
  ,
the inside trajectories evolve towards a limit cycle (figure 13).
For smaller values of
  and
and  ,
e.g. .5 and .001, the separatrix
shrinks when
  increases towards
  , and local
and global stability are lost at the transition.
In any case, when the minimum consumption gets close to the capital depreciation rate at equilibrium, then the likelihood of starting from initial conditions which lead to depletion of the capital is fairly high.